Epsilon: Charts
Your Guide to Using Charts in Epsilon
Introduction
Epsilon supports chart creation and management. This gives you the ability to display information in a way that matches your theme and provides extremely high visual appeal without requiring you to upload any images. It's are built on HTML5, and can be changed quickly on the back end of your site.
Chart.js support is built in that allows you to create rich and infinitely useful charts within a Text widget, or injected directly in a post to add a powerful visual element to your written information.
NOTE: This feature is not currently supported in IE8. Chart.js elements will not display correctly. Newer versions of IE, as well as updated Chrome, Firefox, Safari, Opera, and other popular standard-compliant browser options should work just fine.
Chart.js Support
Epsilon introduces built-in support for Chart.js. This element allows you to quickly and easily create dynamic graphs that display information in a variety of ways.
You can toggle this feature on and off by navigating to Administrator -> Epsilon Theme -> Gizmos -> Chart and toggling the option there. If you have a Custom HTML and/or post with the Chart.js code present, and this option is off, nothing will appear in its place and your browser may indicate a JavaScript error.
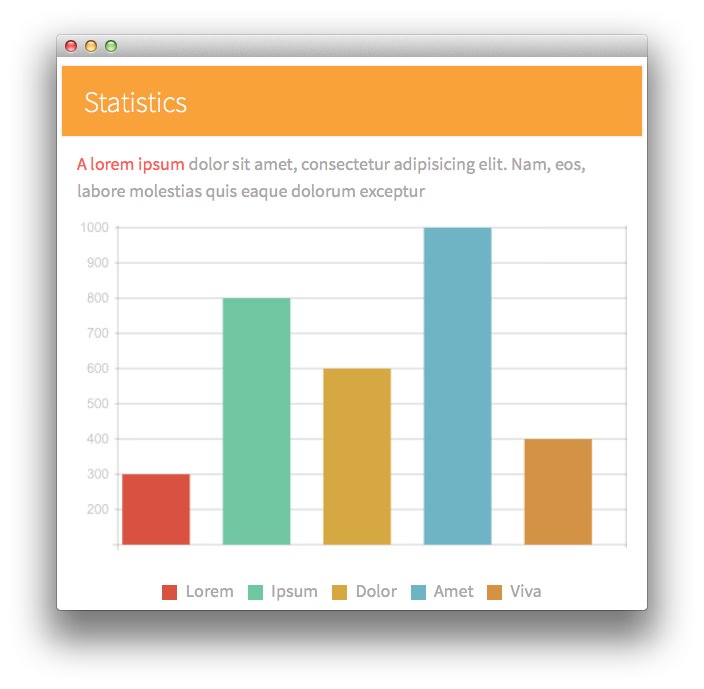
Here is the code block that creates the graph that appears in the above image. In this case, it was placed within a Text widget titled Statistics.
<p><a href="#">A lorem ipsum</a> dolor sit amet, consectetur adipisicing elit. Nam, eos, labore molestias quis eaque dolorum exceptur</p>

<canvas id="myChart" height="318" width="500"></canvas>

<script type="text/javascript">
    var barChartData = {
        labels : [""],
        datasets : [
            {
                fillColor : "#D95240",
                strokeColor : "#D95240",
                data : [300]
            },
            {
                fillColor : "#6FC6A0",
                strokeColor : "#6FC6A0",
                data : [800]
            },
            {
                fillColor : "#D6A842",
                strokeColor : "#D6A842",
                data : [600]
            },
            {
                fillColor : "#6FB4C5",
                strokeColor : "#6FB4C5",
                data : [1000]
            },
            {
                fillColor : "#D49245",
                strokeColor : "#D49245",
                data : [400]
            }
        ]
    },
    options = {
        //Boolean - If we want to override with a hard coded scale
        scaleOverride : true,

        //** Required if scaleOverride is true **
        //Number - The number of steps in a hard coded scale
        scaleSteps : 9,
        //Number - The value jump in the hard coded scale
        scaleStepWidth : 100,
        //Number - The scale starting value
        scaleStartValue : 100,

        //String - Scale label font colour
        scaleFontColor : "rgba(0,0,0,0.2)",

        //String - Colour of the scale line
        scaleLineColor : "rgba(0,0,0,0.2)",

        //String - Colour of the grid lines
        scaleGridLineColor : "rgba(0,0,0,0.2)",

        //Number - Spacing between data sets within X values
        barDatasetSpacing : 30,
    }

    //Get the context of the canvas element we want to select
    var ctx = document.getElementById("myChart").getContext("2d");
    var myNewChart = new Chart(ctx).Bar(barChartData, options);

</script>


<div class="rds-infos rt-center">
    <span class="rds-info">
        <span class="rt-data-1"></span> <span>Lorem</span>
    </span>
    <span class="rds-info">
        <span class="rt-data-2"></span> <span>Ipsum</span>
    </span>
    <span class="rds-info">
        <span class="rt-data-3"></span> <span>Dolor</span>
    </span>
    <span class="rds-info">
        <span class="rt-data-4"></span> <span>Amet</span>
    </span>
    <span class="rds-info">
        <span class="rt-data-5"></span> <span>Viva</span>
    </span>
</div>
You can find extensive documentation listing the different elements found here on the official website.