Acacia: Recreating the Demo - Gantry 4 Framework
Your Guide to Recreating Elements of the Acacia Template for Joomla
Gantry 4 Framework
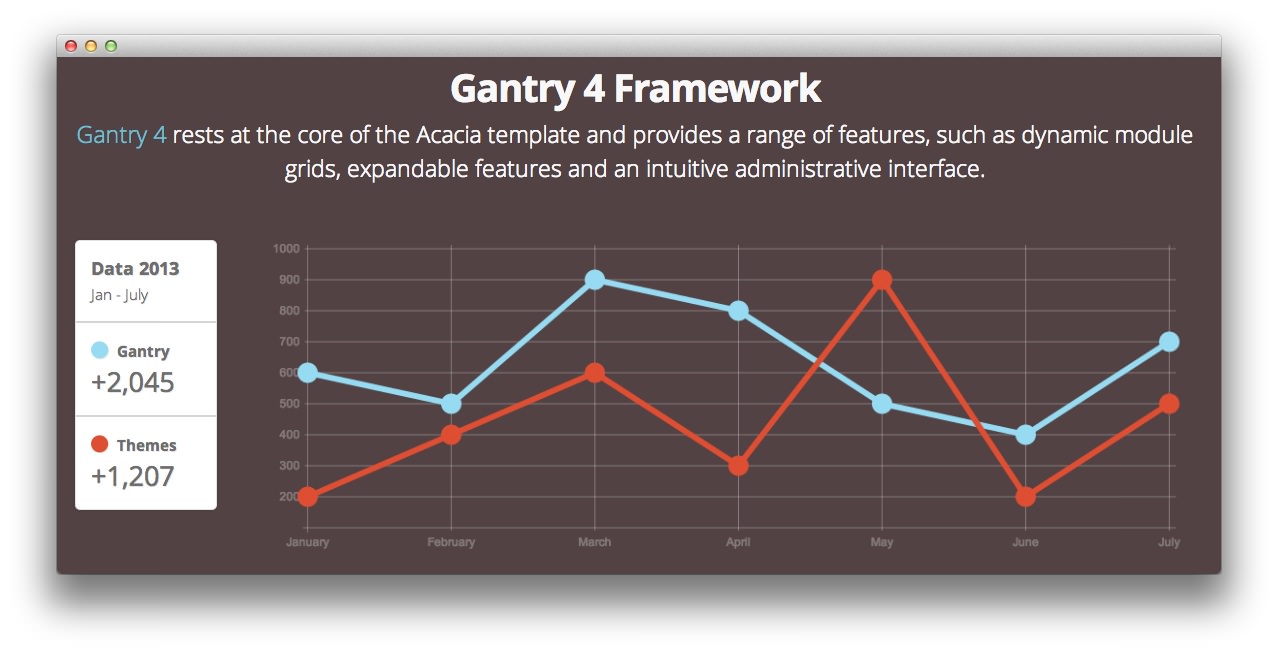
This area of the front page is a Custom HTML module. You will find the settings used in our demo below.
Any mod_custom (Custom HTML) modules are best handled using either RokPad or no editor as a WYSIWYG editor can cause issues with any code that exists in the Custom Output field.
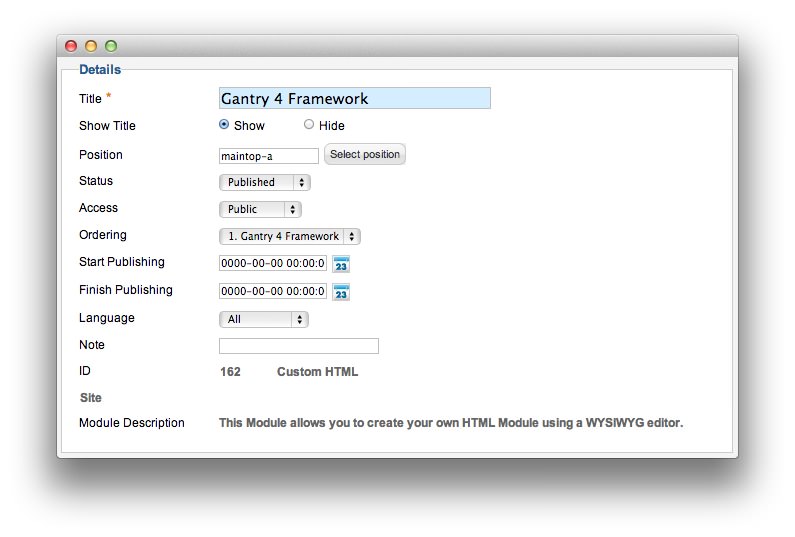
Details
| Option | Setting |
|---|---|
| Title | Gantry 4 Framework |
| Show Title | Show |
| Position | maintop-a |
| Status | Published |
| Access | Public |
| Language | All |
| Note | Blank |
Custom Output
Enter the following in the Custom Output text editor.
<p class="rt-intro-text rt-center"><a href="#">Gantry 4</a> rests at the core of the Acacia template and provides a range of features, such as dynamic module grids, expandable features and an intuitive administrative interface.</p>

<br />

<div class="gantry-width-15">
    <div class="gantry-width-spacer">
        <div class="box1">
            <div class="rt-demo-statistic visible-desktop">
                <div class="rds-title">
                    <strong>Data 2013</strong><br />
                    <small>Jan - July</small>
                </div>
                <div class="rds-separator"></div>
                <div class="rds-data">
                    <span class="icon-circle rds-data-1"></span> <strong>Gantry</strong><br />
                    <h2>+2,045</h2>
                </div>
                <div class="rds-separator"></div>
                <div class="rds-data">
                    <span class="icon-circle rds-data-2"></span> <strong>Themes</strong><br />
                    <h2>+1,207</h2>
                </div>
            </div>
            <div class="rt-demo-statistic visible-tablet">
                <div class="rds-data nomargintop">
                    <span class="icon-circle rds-data-1"></span> <strong>Gantry</strong><br />
                    <h2>+2,045</h2>
                </div>
                <div class="rds-separator"></div>
                <div class="rds-data">
                    <span class="icon-circle rds-data-2"></span> <strong>Themes</strong><br />
                    <h2>+1,207</h2>
                </div>
            </div>
        </div>
    </div>
</div>

<div class="gantry-width-85">
    <div class="gantry-width-spacer">
        <canvas id="myChart" height="320" width="977"></canvas>

        <script type="text/javascript">
            var lineChartData = {
                labels : ["January","February","March","April","May","June","July"],
                datasets : [
                    {
                        fillColor : "transparent",
                        strokeColor : "#97DBF2",
                        pointColor : "#97DBF2",
                        pointStrokeColor : "#97DBF2",
                        data : [600,500,900,800,500,400,700]
                    },
                    {
                        fillColor : "transparent",
                        strokeColor : "#DE4E33",
                        pointColor : "#DE4E33",
                        pointStrokeColor : "#DE4E33",
                        data : [200,400,600,300,900,200,500]
                    }
                ]
            },
            options = {
                //Boolean - If we want to override with a hard coded scale
                scaleOverride : true,

                //** Required if scaleOverride is true **
                //Number - The number of steps in a hard coded scale
                scaleSteps : 9,
                //Number - The value jump in the hard coded scale
                scaleStepWidth : 100,
                //Number - The scale starting value
                scaleStartValue : 100,

                //String - Scale label font colour
                scaleFontColor : "rgba(255,255,255,0.3)",

                //String - Colour of the scale line
                scaleLineColor : "rgba(255,255,255,0.3)",

                //String - Colour of the grid lines
                scaleGridLineColor : "rgba(255,255,255,0.3)",

                //Boolean - Whether the line is curved between points
                bezierCurve : false,

                //Number - Radius of each point dot in pixels
                pointDotRadius : 8,

                //Number - Pixel width of point dot stroke
                pointDotStrokeWidth : 5,

                //Number - Pixel width of dataset stroke
                datasetStrokeWidth : 6,

                //Boolean - Whether to fill the dataset with a colour
                datasetFill : true,

            }

            //Get the context of the canvas element we want to select
            var ctx = document.getElementById("myChart").getContext("2d");
            var myNewChart = new Chart(ctx).Line(lineChartData, options);

        </script>
    </div>
</div>

<div class="clear"></div>
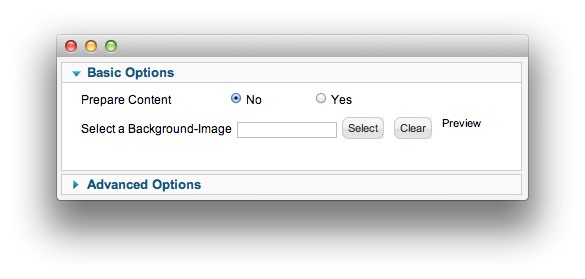
Basic
| Option | Setting |
|---|---|
| Prepare Content | No |
| Select a Background Image | Blank |
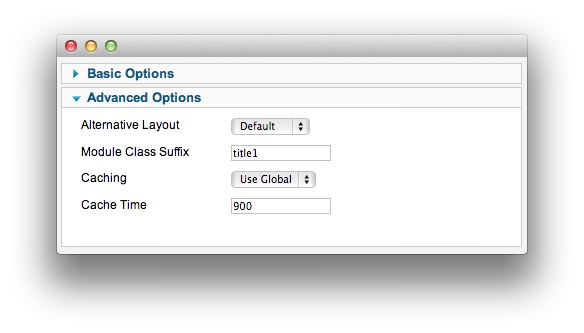
Advanced
| Option | Setting |
|---|---|
| Module Class Suffix | title1 |
Found errors? Think you can improve this documentation? Please edit this page. You can also view the history of this page.